

What happened?
Part 1: Initial Observations (November 20, 2020)

“There’s a difference between a contest where a candidate leads 53 percent to 45 percent, with 2 percent undecided, and one where the lead is 46 percent to 38 percent with 16 percent undecided. The eight-point margin is the same, but the contours of the race, and the outcomes, could well be quite different.”
Mark Mellman, in The Washington Post.
When I am asked “what happened?” in the aftermath of this year’s election there are usually two dimensions to that question (so far). The first is why did Senate (and other down ballot) candidates underperform compared to Biden/Harris ticket? The second is why did Senate candidates do worse than the polling indicated they would? This post will begin to address these questions. There will be a lot more to say on these questions over the next few months as we get more data and have some time to reflect on the election.
Senate polling and results
As we get more data in from the election one thing looks generally true: Biden outperformed Democratic Senate candidates in many states. Two states that this did not hold true for were Arizona and Colorado – which were the two states that Democrats picked up Senate seats (and Biden won both also). But, in some toss-up Senate races Biden was outperformed by the Democratic candidates, which is what happened in South Carolina and Montana. Other competitive Senate seats in which the Democratic nominee outperformed Biden include Kansas and Kentucky (the latter of which was never really competitive).
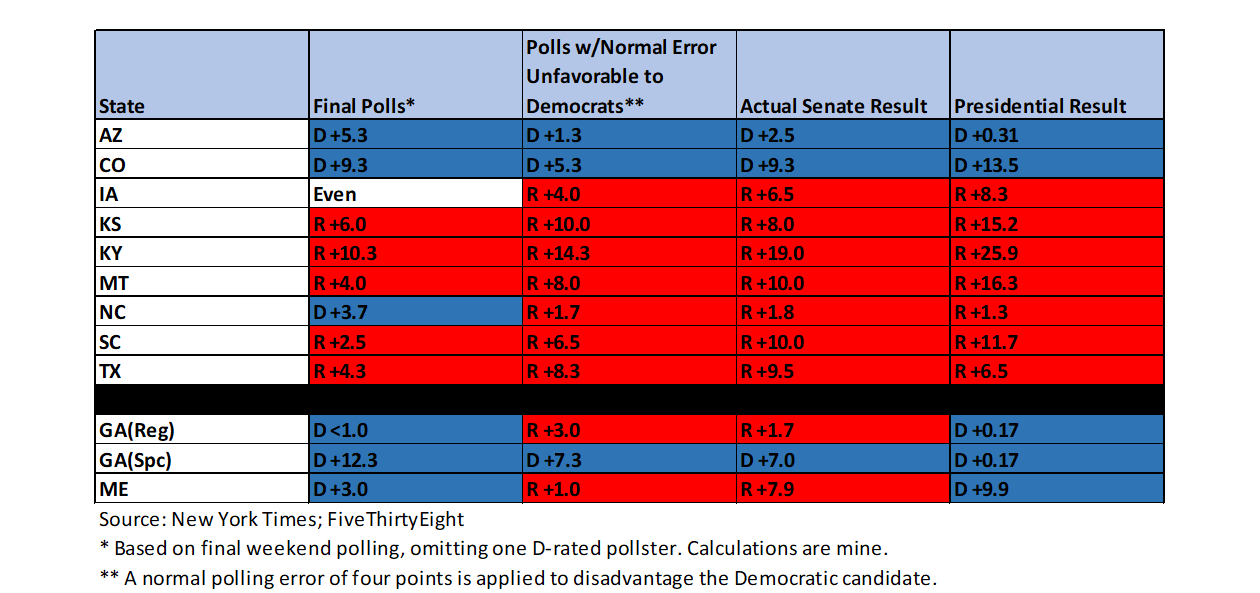
In the table above, you can see what the final polling was for the Senate seats considered competitive by the end of the campaign. The third column represents a normal polling error of four points applied unfavorably to the Democratic candidate’s “Final Polls” from the second column. Compare this with the actual margin of victory in the third column. The fourth column represents the margin of victory in the presidential race for comparison. Georgia and Maine are considered separately on this chart; Georgia because the results will not be final until the January 5th run-offs and Maine because it represents an unusual case that will be discussed in more detail in my next post.
The first thing to notice is that by the final weekend of the campaign, the current adjusted polling (column three) was showing that in the nine states in the top section of the chart only two were actually close: Arizona and North Carolina. One could make a case for Iowa, especially because the polls were fairly evenly split over who would win (usually a sure sign of a toss-up race). Using the unadjusted numbers (column 2), one might think Iowa was the only close race.*** This is because of two of the biggest challenges for polling: the public’s expectation of exactitude in the results and the way results are portrayed in the media.
Popular and Media Expectations
If you have been a regular reader of this newsletter you’ll know that polls do not work that way. Polls are not exact; only a true population count would be exact. Poll results are probability-based estimates. When we say Biden is leading 51-49 with a three point margin of error. That means that 90-95% of the time (depending on probability model) we expect Biden’s true support to be between 48% and 54% of the population. Three percent is really good for a polling MOE. Four percent is more common, which is why that represents a “normal” polling error.****
The media - and this is universal regardless of partisan lean or journalistic integrity - portrays polls as showing exact numbers of support. To be fair, many media outlets these days make an effort to explain the inexactitude of polling in their articles. But the headlines almost always portray polling with exactitude. In the example from the previous paragraph, a typical headline for a story about that poll would be “New Poll Has Biden Leading with 51%.” A more accurate headline would be “Between 48% and 54% Support Biden in New Poll.” Few people read past the headline and maybe the first paragraph in polling stories so headlines are more the culprit in popular misunderstanding than the articles are. Headlines are not usually written by the reporters.
Initial Turnout Data and Very Preliminary Findings
We're starting to get some precinct level turnout data now. So far, it looks like the Black share of the electorate was down this year, even though turnout was up. This can happen because other racial groups had bigger turnouts thus increasing their share. In Georgia, Black share of the vote was 27%, down from 27.7% in 2016 and from ~30% in 2012 and 2008. The 2018 midterm share of the Black vote was 29%. What this means is that there is room to grow for the runoffs. (According to the 2019 Census estimates, Blacks make up 31.9% of the Georgia population.) The same story appears to be true in North Carolina. Also, there was no increase in Black turnout (or at least no significant increase) in Detroit, Milwaukee, and Philadelphia.
In some states, the exit polling shows that women supported Biden in higher proportions than supported the Democratic Senate candidate in their state. In Maine, woman support for Biden was significant: fourteen points higher than for Senate Democratic nominee Sara Gideon. In states like Colorado, Georgia, and North Carolina, women voted for Biden by two or three points higher than the Democratic Senate candidates. While much closer than Maine, the difference could have cost Democrat Cal Cunningham the Senate seat in North Carolina and could have been the difference between a run-off for Georgia’s regular Senate seat and an outright victory for Democrat Jon Ossoff.
The difference between Biden’s support and Democratic Senate nominees has a geographical dimension as well. Biden performed better in rural areas and in the suburbs. Even in the cities where Democrats could have run up the score, there was uneven support for the Democratic candidates. But, the two things that look important here are uneven support for Democratic candidates by women in the suburbs and little support for Democratic candidates in rural areas, even where Biden did relatively well.
Trump captured a larger portion of the Latino vote than expected, which almost certainly has to do with treating this community as monolithic rather than one with varied concerns based on things like national origin or regional location. In North Carolina, Trump won 42% of Latinos, which represented five percent of the electorate. In Texas, where Latinos made up nearly a quarter of the electorate, 41% voted for Trump. In addition, the white Evangelical turnout was up this year and greatly favored Trump as one would expect. Both of these issues were problems for Biden as well as Democratic Senate candidates, and it does not appear that they explain why Democratic Senate candidates would underperform Biden in most competitive places.
So, while data keeps coming in and we try to keep up with it, I have a working hypothesis which I suspect will need some major tinkering as we get better data: Suburban women voted strongly for Biden, but a non-trivial number also voted Republican in the Senate race. Black share of the vote was too low to run up the score enough for Senate candidates. Biden’s strengths in appealing to the so-called white working class and rural voters - where it was successful - did not translate into support for other Democratic candidates. The question of why all of this happened is something to discuss on another day.
Not everyone agrees. Charlie Cook says that the election was anti-Trump, but not anti-GOP. Even though undecideds were smaller group than in 2016, they appear to have broken for Trump at the last minute. Toss-ups generally broke for the GOP, while Biden won as expected. Toss-up generally do break to one party or the other, but we thought they might break with Democrats this time mostly because of how strongly Biden was doing. Larry Sabato does not think ticket-splitting explains the discrepancy in voting. While he is correct overall, in toss-up states that Biden was competitive in I think ticket-splitting might help explain some of the results. Sabato might agree with that characterization, but I don’t want to put words in his mouth. Jamelle Bouie at the New York Times thinks the reason is simpler: voters credit Trump and the GOP for the financial benefits of the CARES Act, regardless of the role Democrats played in shaping it to benefit small business and average and low-income taxpayers. Centrist Democrats are complaining that progressives cost them elections, although leftist candidates did very well this year.
But as far as the polling goes, here are the two things that likely impacted our expectations. First, a partisan non-response problem that made it more difficult to estimate support for Republicans. Second, although they were small compared to 2016, undecideds broke late for the GOP. The polling did a really good job of estimating Democratic support, but it did not do a good job estimating Republican support.
In future posts, we’ll look at the data in some states, both individually and comparatively. As better data becomes available, I will revisit some of the initial observations in this post.
* and ** are footnotes under the table.
*** What is interesting is that the final weekend polling average for the Colorado Senate was was right on the money. Democratic former Governor John Hickenlooper defeated GOP Senator Cory Gardner by the same 9.3 point margin as the final weekend polling average.
**** Here, we are using terms as they are commonly used but in the process we are conflating two different problems. “Polling error” should refer to error outside the MOE when evaluating polls, but frequently we talk about “error” as results that are different than reported regardless of whether that “error” is within the MOE. This is likely because we talk more about polling averages these days and polling averages do not have margins of error associated with them. Polling averages are not themselves polls.